On the first day of kindergarten, some children will be able to make friends, take turns, follow directions and focus on a task, while others will struggle in the classroom. Quality early experiences and relationships with trusted adults during children’s earliest years build strong brain architecture that supports growth of cognitive and social-emotional skills that yield benefits for a lifetime. Children who arrive at kindergarten without these skills often never catch up to their peers, leading to lower graduation rates, lower post-secondary attainment and decreased likelihood of high-earning jobs as adults. Reaching these children at risk can change their academic and life trajectories. We find children at risk across Nebraska, in all counties, and in both rural and urban communities.
Click map to view a table with specific information on each county, including the numbers and percentages of children at risk.
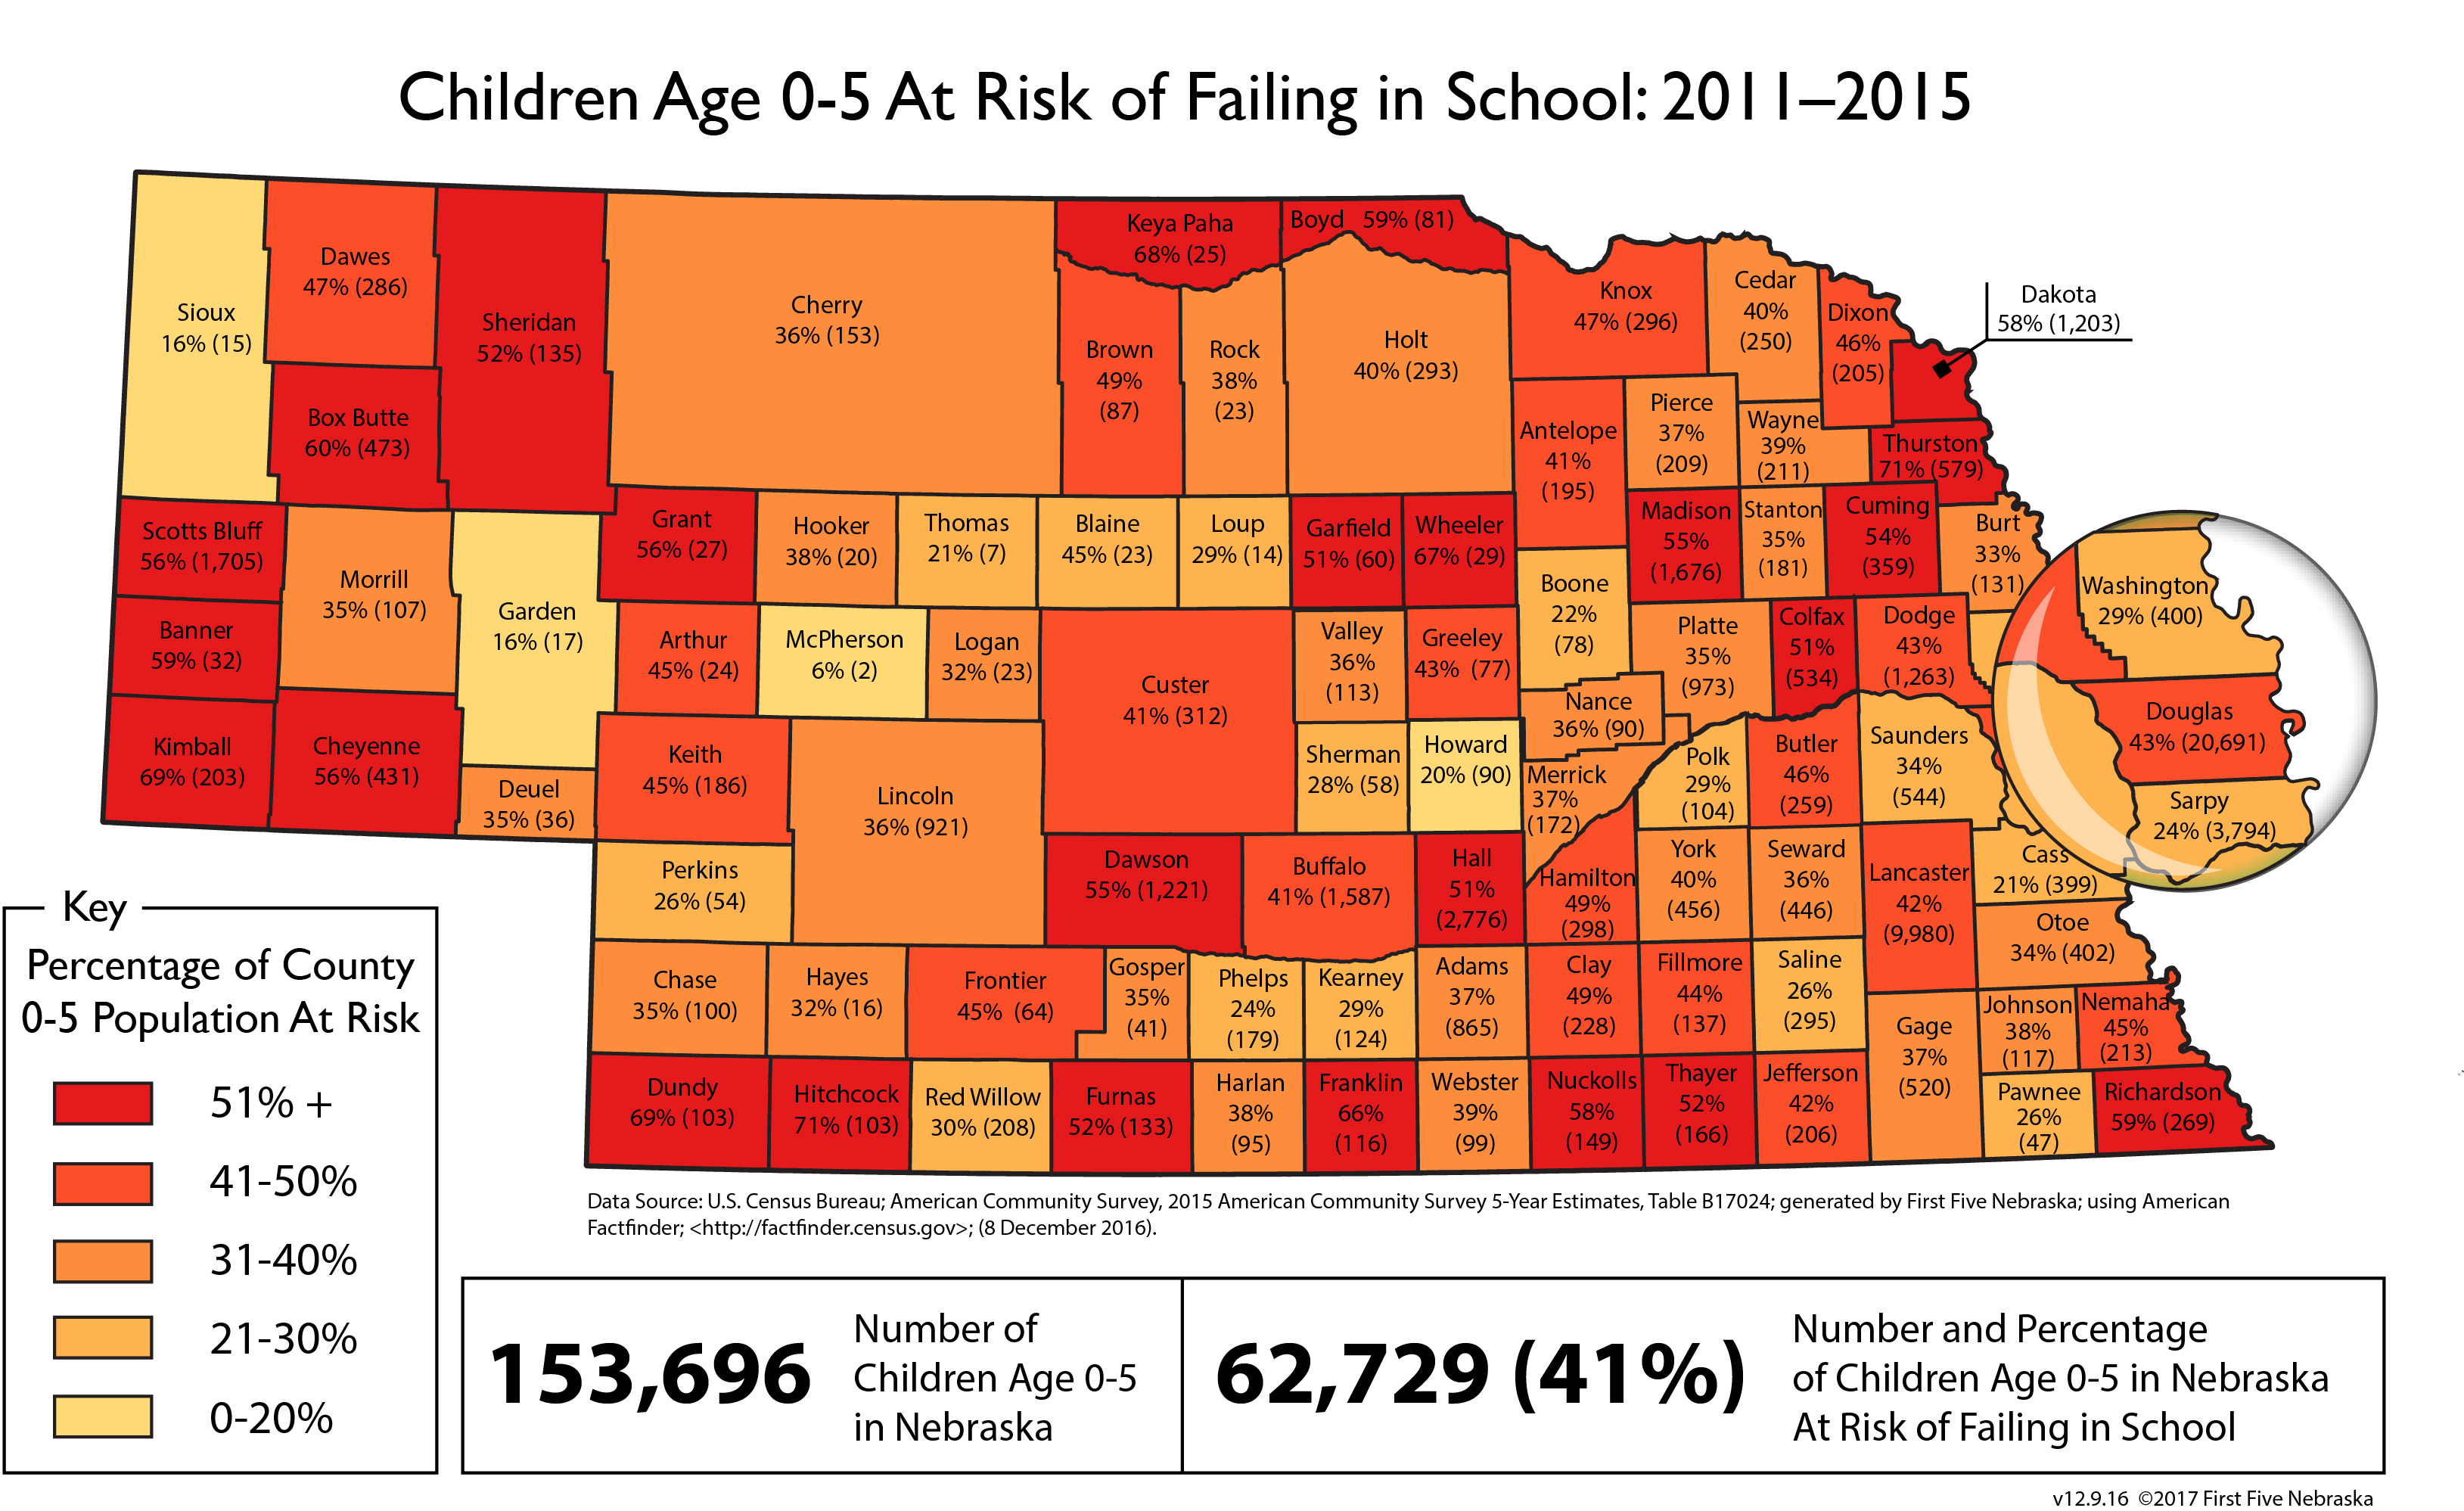
The map reflects newly released U.S. Census data showing 62,729, 41% of Nebraska’s 153,696 children ages 0-5, are “at-risk” of failing at school. To create the map, we applied the definition of “at risk” used by the Nebraska Department of Education. This definition includes four factors; to avoid counting a child more than once, we counted only those children ages 0-5 who are subject to the first risk factor, which is a family income below 185% of the Federal Poverty Level. Children falling into this risk factor likely fall into the other three. To calculate the percentage of children 0-5 at risk, the number of children 0-5 at risk was divided by the total number of children 0-5.
First Five Nebraska developed this map to help Nebraskans make strategic investments that will alter the lives of children at risk and create a path for them to become successful students and adults.
The 2015 American Community Survey (ACS) is released each year in early December by the U.S. Census Bureau.
Source: U.S. Census Bureau, American Fact Finder. 2011-2015 American Community Survey 5-Year Estimates. “Age by ratio of income to poverty level in the past 12 months.”